Pages

Sunday, 16 December 2018

Weekly Equity Report 17 Dec to 21st Dec 18 | Zoid Research

NIFTY (SPOT) @ 10805


Nifty this week given close around 10805 with green note, this week it performed high
volatile session, after 5 states election result it given good bounce back from lower levels
and end of day given close with bullish candle, buy on decline strategy downside it has
good support around 10480-10500 on closing basis and upside it will be test 10980-
11150+ levels, best buying levels around 10650-10660, overall trend is bullish and don’t go
for aggressive short sell use any downside fall for buying only and keep close watch on
given levels.


BANK @ 26826

Nifty Bank this week given close around 26826 with green note, this week it performed high
volatile session, after 5 states election result it given good bounce back from lower levels
and end of day given close with bullish candle, buy on decline strategy downside it has
good support around 25950-26000 on closing basis and upside it will be test 27300-27800
levels, best buying levels around 26450-26480, overall trend is bullish and don’t go for
aggressive short sell use any downside fall for buying only and keep close watch on given
levels.

TREND DECIDER THIS WEEK 26458


JUSTIFICATION

ICICI BANK FUT Taking support of trend line in weekly chart there is major support level
is 341 and Also trend line showing buying side in weekly chart. We have recommend Buy
on dip with target of 359 to 365 levels. And there is strong support level 218.85. 


JUSTIFICATION


COALINDIA FUT trading at weekly support level 225 and closing above major resistance level 240 and sustain it .We have recommended COAL INDIA FUT buy on dip with target 254 to 261 and strong Weekly support level is 234 .


JUSTIFICATION

This week LTI given close around 1810 with bullish candle due to short covering move and fresh buying also, in daily chart found fresh breakout buy on decline strategy best buying around 1688-1690 and keep stop loss of 1560 below on closing basis upside it will be test 1940-2070+ watch out.


JUSTIFICATION

This week INDIAN BANK given close around 240+ with bullish candle due to short covering move and fresh buying also, in daily chart found fresh breakout buy on decline strategy best buying around 232-233 and keep stop loss of 221 below on closing basis upside it will be test 250-262+ watch out. 


Saturday, 8 December 2018

Weekly Equity Report - 8 Dec 18 | Zoid Research

NIFTY (SPOT) @ 10693

Nifty this week given close around 10693 with green note, this week we saw high volatility
due to many number of domestic and global events, but finally end of this week it given
close with green note around 10693, according to upcoming week we expected more
volatility in nifty so be cautious on every levels after election final outcome either side one
way rally we will see so don’t hold any major position, upside it continue facing resistance
around 10750-10780 on closing basis and downside it has good support around 10580-
10600 in this week when it close below or above this rang then go with the trend 100-200
points more one sided rally we will expected, so be cautious on every levels and keep close
watch on given levels. 

TREND DECIDER THIS WEEK 10740


NIFTY BANK @ 26594


Nifty Bank this week given close around 126594 with green note, this week we saw high
volatility due to many number of domestic and global events, but finally end of this week it
given close with green note around 26594, according to upcoming week we expected more
volatility in nifty so be cautious on every levels after election final outcome either side one
way rally we will see so don’t hold any major position, upside it continue facing resistance
around 26800-26900 on closing basis and downside it has good support around 26100 in
this week when it close below or above this rang then go with the trend 500-800 points
more one sided rally we will expected, so be cautious on every levels and keep close watch
on given levels.

TREND DECIDER THIS WEEK 26593


WEEKLY OPTION RECOMMENDATIONS: 


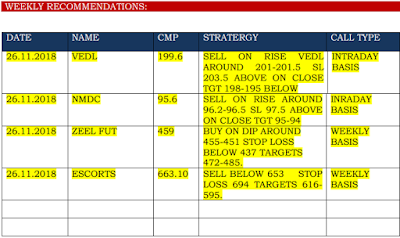
Monday, 26 November 2018

Weekly Equity Report - 26 Nov 30 Nov 18 - Zoid Research

NIFTY (SPOT) @ 10526

Nifty this week given close around 10526 with negative basis, due to mix global market
sentiments and elections in some states range bound and swing trend is seen and will more
swing will be seen in coming days, this week is it given minor negative closing as upside it
has strong resistance around 10750-10980 and it has weekly trend decider level is 10604 if
it close below then more downside fall we will see in upcoming day’s so don’t carry heavy
position in portfolio downside it will test 10300-10110 so be cautious on higher levels and
sell on rise strategy can be followed, keep close watch on given levels and global market
updates watch out.


BANK @ 25999

Nifty Bank this week given close around 25999 with negative basis below the major
support and trend decider @ 26000, but don’t hurry for fresh buying keep close watch
global market update, upside it has first resistance around 26250 and it has weekly trend
decider level is 25987, if it close below then more downside fall possible up to 25500-25000
so be cautious on higher levels, this week it given close with flat basis due to long covering
move, so keep close watch on given levels, watch out.

TREND DECIDER THIS WEEK 25987


JUSTIFICATION -

PIDILITIND FUT trading above 50 days SMA & close in weekly chart. Also share trading
above major resistance level 1126.20. We have recommended PIDILITIND FUT buy on dip
with target 1171 to 1192 and strong support level is 1083 .


JUSTIFICATION

VEDL FUT trading below major support level 201.10 and trading below 50 days SMA.
Also trend line showing selling side in weekly chart. We have recommend sell on rise with
target of 194 to 185 levels. And there is strong resistance level 218.85. 


CANDELSTICK CHART :- HDFC LIFE


JUSTIFICATION

This week HDFC LIFE given close around 393.3 with bullish candle due to short covering move and fresh buying also, in daily chart found fresh breakout buy on decline strategy best buying around 388.5-389.5 and keep stop loss of 384 below on closing basis upside it will be test 400-404+ watch out.


CANDELSTICK CHART : WELCORP CASH


JUSTIFICATION

This week WELCORP given close around 159.6+ with bullish candle due to short covering move and fresh buying also, in daily chart found fresh breakout buy on decline strategy best buying around 158.5-159 and keep stop loss of 154 below on closing basis upside it will be test 165-170+ watch out.