Pages

Showing posts with label equity report. Show all posts

Monday, 26 November 2018

Weekly Equity Report - 26 Nov 30 Nov 18 - Zoid Research

NIFTY (SPOT) @ 10526

Nifty this week given close around 10526 with negative basis, due to mix global market
sentiments and elections in some states range bound and swing trend is seen and will more
swing will be seen in coming days, this week is it given minor negative closing as upside it
has strong resistance around 10750-10980 and it has weekly trend decider level is 10604 if
it close below then more downside fall we will see in upcoming day’s so don’t carry heavy
position in portfolio downside it will test 10300-10110 so be cautious on higher levels and
sell on rise strategy can be followed, keep close watch on given levels and global market
updates watch out.


BANK @ 25999

Nifty Bank this week given close around 25999 with negative basis below the major
support and trend decider @ 26000, but don’t hurry for fresh buying keep close watch
global market update, upside it has first resistance around 26250 and it has weekly trend
decider level is 25987, if it close below then more downside fall possible up to 25500-25000
so be cautious on higher levels, this week it given close with flat basis due to long covering
move, so keep close watch on given levels, watch out.

TREND DECIDER THIS WEEK 25987


JUSTIFICATION -

PIDILITIND FUT trading above 50 days SMA & close in weekly chart. Also share trading
above major resistance level 1126.20. We have recommended PIDILITIND FUT buy on dip
with target 1171 to 1192 and strong support level is 1083 .


JUSTIFICATION

VEDL FUT trading below major support level 201.10 and trading below 50 days SMA.
Also trend line showing selling side in weekly chart. We have recommend sell on rise with
target of 194 to 185 levels. And there is strong resistance level 218.85. 


CANDELSTICK CHART :- HDFC LIFE


JUSTIFICATION

This week HDFC LIFE given close around 393.3 with bullish candle due to short covering move and fresh buying also, in daily chart found fresh breakout buy on decline strategy best buying around 388.5-389.5 and keep stop loss of 384 below on closing basis upside it will be test 400-404+ watch out.


CANDELSTICK CHART : WELCORP CASH


JUSTIFICATION

This week WELCORP given close around 159.6+ with bullish candle due to short covering move and fresh buying also, in daily chart found fresh breakout buy on decline strategy best buying around 158.5-159 and keep stop loss of 154 below on closing basis upside it will be test 165-170+ watch out. 


Saturday, 13 October 2018

Equity Weekly Report - 15 - 19 Oct 18 | Zoid Research

NIFTY (SPOT) @ 10472

Nifty this week given close around 10472 with green note, this week we saw high volatility
due to global market uncertainty and some good and bad news related to global market
condition, but finally end of this week it given close with green note and it has good support
around 10150-10200 on closing basis if it hold this levels then more upside move we will
see in upcoming sessions, upside it has first resistance around 10595 and second will be
10720 and weekly trend decider level is 10360-10370 on closing basis keep close watch on
these given levels.


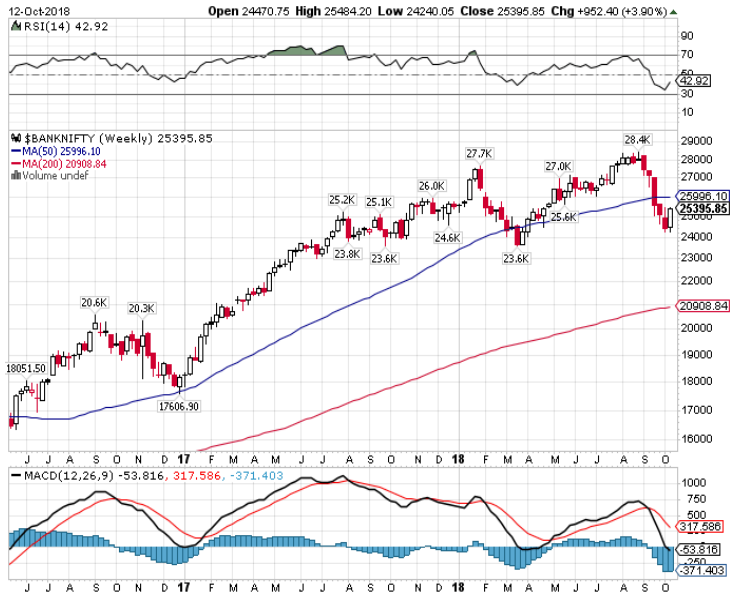
BANK @ 25395 

Nifty Bank this week given close around 25395 with bullish note, this week we saw it
traded both side but end of this week given close around higher levels due to short covering
move, downside it has good support around 24500 on closing basis and upside it has first
resistance around 25830 and second will be 26250+ and weekly buying levels is 25380-
25400, work with strict stop loss and keep close watch on global market also.


JUSTIFICATION

TATA POWER had been framed a Bullish green big candle in weekly chart also share close above major resistance level 67.20 we have recommended TATA POWER future buy on dip with target 74 to 79 and strong support level is 65 .


JUSTIFICATION

MARUTI FUTURE trading above 7250 weekly multiple resistance level 7200, and made a bullish hammer candle we have recommend buy on dip strategy with target 7450 and 7750 level. And there is strong support level 6970.


JUSTIFICATION

ADANIPOWER in this week given good upside rally this week it given close around 32.55 near to highest levels, buy on decline strategy don’t go for short sell use any decline for buying only, best buying levels around 28.5-29 + keep stop loss of 25 below on close upside it will be test around 35- 38+ levels watch out.


JUSTIFICATION

ITC in weekly chart showing first signal for upside move, this week it taken good support around weekly lower levels and given reversal and close around 200 DMA levels if it sustaining above this levels then upside good move possible here buy on decline around 270-272 keep small stop loss of 265 below on close upside it will be test around 290+ watch out.