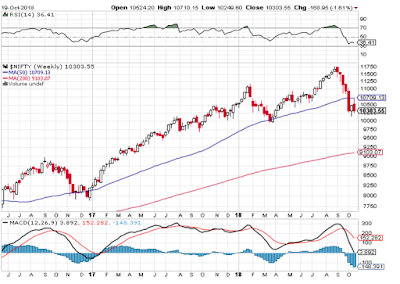
NIFTY (SPOT) @ 10303
Nifty was closed below 10350 I,e @ 10303.55 in the closing of the week as followed by
bearish trend. Nifty spot still trading below 50 MA in weekly chart and near to its major
support @ 9100 of 200 MA. In the last five days of trading sessions somehow Nifty spot has
been traded in a consolidation range b/w 10500-10300 with lots of zigzag and still closing
below 10 EMA and 200 EMA in daily chart. Nifty spot has make pattern cloud cover which
shows bearish pattern in index, If falling further then we can expect Nifty spot to be kissing
the level of 10100-9800 in further expiry.
TREND DECIDER THIS WEEK 10420


support level; 1000 ,As per bearish flag pattern we have recommend sell on rise strategy
with target 940 to 896.45 level . and there is strong resistance level 1052.


Nifty was closed below 10350 I,e @ 10303.55 in the closing of the week as followed by
bearish trend. Nifty spot still trading below 50 MA in weekly chart and near to its major
support @ 9100 of 200 MA. In the last five days of trading sessions somehow Nifty spot has
been traded in a consolidation range b/w 10500-10300 with lots of zigzag and still closing
below 10 EMA and 200 EMA in daily chart. Nifty spot has make pattern cloud cover which
shows bearish pattern in index, If falling further then we can expect Nifty spot to be kissing
the level of 10100-9800 in further expiry.
TREND DECIDER THIS WEEK 10420


JUSTIFICATION
RECOHOME FUT had been framed a bearish red big candle in weekly chart also share close below major support level 335. we have recommended RECOHOME future sell on rise with target 276 to 250 and strong resistance level is 342 .

JUSTIFICATION
TATA ELXSI FUTURE made a bearish flag pattern at weekly chart and trading below weeklysupport level; 1000 ,As per bearish flag pattern we have recommend sell on rise strategy
with target 940 to 896.45 level . and there is strong resistance level 1052.

JUSTIFICATION
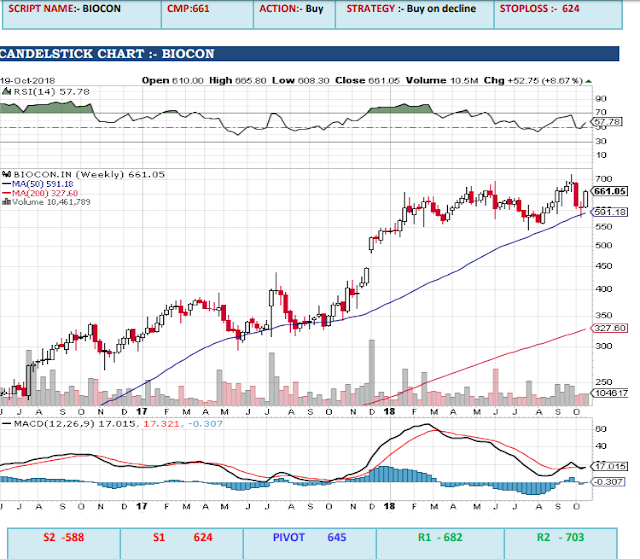
BIOCON in this week given good upside rally this week it given close around 661 near to highest levels, buy on decline strategy don’t go for short sell use any decline for buying only, best buying levels around640-645 + keep stop loss of 624 below on close upside it will be test around 680-700+ levels watch out.

JUSTIFICATION
ADANIENT in weekly chart showing first signal for upside move, this week it taken good support
around weekly lower levels and given reversal and close around 200 DMA levels if it sustaining above this levels then upside good move possible here buy on decline around 160-161 keep small stop loss of 151 below on close upside it will be test around 185+ watch out.5+


watch out.
Profitable stock for investing are ecommended here.
ReplyDeleteFree Stock Tips
For true fans of this thread I will address is a free online! Financial Advisors
ReplyDelete