NIFTY
(SPOT) @ 10316
Nifty
was closed below 10350 I,e @ 10316.45 in the closing of the week as followed by
bearish trend. Nifty spot still trading below 50 MA in weekly chart and showing
a almost black crows technical pattern. In the last five days of trading
sessions somehow Nifty spot has been traded in a consolidation range b/w
11000-10500 with lots of zigzag and still closing below 10 EMA and 200 EMA in
daily chart. Nifty spot has completed 50% on Fibonacci and may take a short
support at 10300. If falling further then we can expect Nifty spot to be kissing
the level of 10100-9800 in further expiry.
BANK @
24443
Nifty
Bank was closed with bearish spike candle and could not able to survive on
positive note. Banking sector imposing heavy Supply and traded below 10 EMA and
200 EMA during the weekly trading session. In the last four trading session
Bank nifty has performed very badly and continuous bearish trend was formed and
finally closed below moving average of 50. If bank nifty still follows the same
pattern and trend then free fall can be seen up to 23700-23000 in daily chart.
Bank nifty has small support in the chart at 23500, if breakdown will seen then
heavy fall was assumed.
CANDELSTICK CHART :- SBIN
JUSTIFICATION
SBIN had been framed a rally base drop pattern in weekly chart also share close below 100 days & 200 days moving average as per pattern and close below 200SMA we have recommended SBIN future sell on rise with target 250 to 235 and strong resistance level is 274
JUSTIFICATION
GAIL FUTURE trading below weekly multiple support level 360 , and made a bearish big red candle we have recommend sell on rise strategy with target 300 and 270 level . and there is strong resistance level 377.50
JUSTIFICATION
JINDALSTEEL&POWER in this week facing huge selling pressure, this week it given close around 175.9 near to weekly close, sell on rise strategy don’t hurry for buy, sell on rise for intraday basis, best selling levels around180-181 and according to weekly chart it has strong resistance around 192+ on closing basis when it close above these levels then some upside move possible, otherwise downside it will be go for 165-154 also watch out.
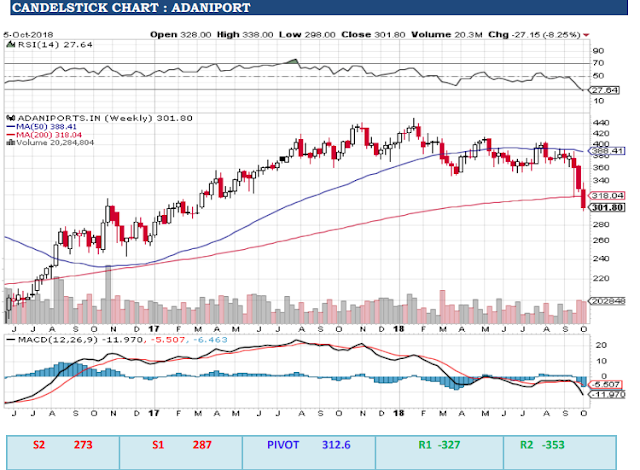
JUSTIFICATION ADANIPORT in weekly chart continue facing selling pressure, this week is given close around 301.8, sell on rise strategy don’t go for buy side this week it given close below 200 DMA levels so that major downfall we will see in upcoming sessions upside it has strong resistance around 325-327+, and best selling levels around 310-312 on weekly basis watch out and downside it will be test 290-275 levels also.


Valuable knowledge of trading is given here. Nice to read daily
ReplyDeleteFree Stock Tips