Pages

Sunday, 28 October 2018

Equity Weekly Report - 29 Oct to 2nd Nov 18 | Zoid Research

NIFTY (SPOT) @ 10030

Nifty this week given close around 10030 with big bearish candle, and this week we saw it
continue facing huge selling pressure due to fresh short and highly volatile global market
uncertainty, this week it break that important support level of 10100 and given close
around 10030, it has important resistance around 10280-10300 and downside it will be
test 9885-9745 and below also, so don’t hurry about buy sell on rise strategy only don’t go
for aggressive long side watch out. 
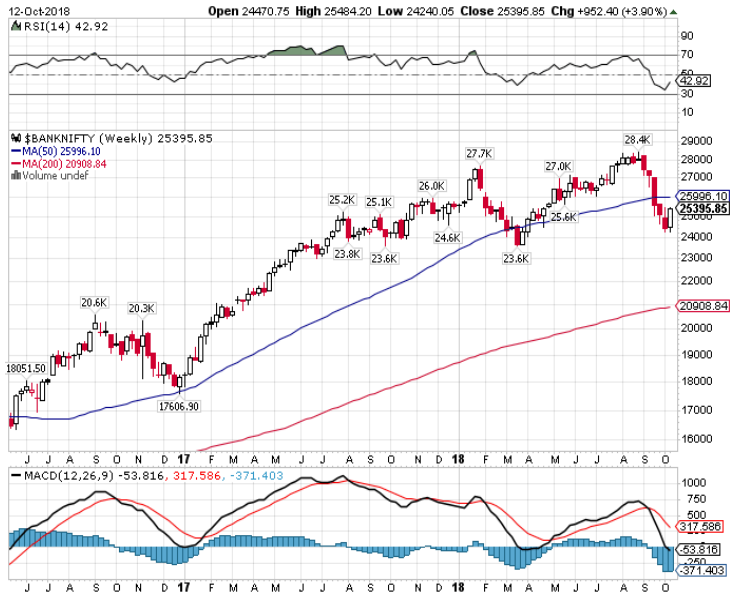
BANK @ 24421 


Nifty Bank this week given close around 24421 with big bearish candle, this week it
continue facing selling pressure due to profit booking on higher levels, this week it not able
to cross resistance level of 25500 and in last trading session it given close below important
support level of 24500 below, sell on rise only don’t go for aggressive buy side downside it
will be test 24000 and below levels upside it has first resistance around 25160-25500 + on
closing basis this week trend decider level is 24750-24760 keep close watch when it come
go for short sell with same given stop loss watch out.

TREND DECIDER THIS WEEK 24759


JUSTIFICATION


This week RELCAPITAL given close around 225.25 with big bearish candle due to heavy short sell form resistance levels, in weekly chart it break that all important support levels and continue facing selling pressure sell on rise strategy best selling around 230-232 keep stop loss of 242+ on closing basis downside it will be test 216-208 below watch out.


JUSTIFICATION


On weekly chart AXIS BANK this week given close with big bearish candle around 540, due to 
profit booking on resistance levels, sell on rise only don’t go for buy side sell on rise around 
550-552 keep stop loss around 568+ on closing basis downside it will be test 525-510 below 
watch out.


JUSTIFICATION

This week BHARATFIN given close around 875 with big bearish candle due to heavy short sell form resistance levels, in weekly chart it break that all important support levels and continue facing selling pressure sell on rise strategy only for daily basis, weekly important resistance around 950 levels and downside it will be test 835-800 below also watch out.


JUSTIFICATION


SBIN in weekly given breakdown and given close with bearish candle around 248, don’t go for aggressive by side on the weekly basis we expected more downside fall we will see in upcoming days it has good selling level on weekly basis around 252-253 and it has first resistance around 260 on closing basis downside it will be test around 242-235 watch out.

WEEKLY RECOMMENDATIONS:

 WEEKLY OPTION RECOMMENDATIONS:


Saturday, 20 October 2018

Equity Weekly Report - 22 to 26 Oct 18

NIFTY (SPOT) @ 10303

Nifty was closed below 10350 I,e @ 10303.55 in the closing of the week as followed by
bearish trend. Nifty spot still trading below 50 MA in weekly chart and near to its major
support @ 9100 of 200 MA. In the last five days of trading sessions somehow Nifty spot has
been traded in a consolidation range b/w 10500-10300 with lots of zigzag and still closing
below 10 EMA and 200 EMA in daily chart. Nifty spot has make pattern cloud cover which
shows bearish pattern in index, If falling further then we can expect Nifty spot to be kissing
the level of 10100-9800 in further expiry.

TREND DECIDER THIS WEEK 10420


JUSTIFICATION


RECOHOME  FUT had been framed a bearish red big candle in weekly chart also share close below major support level 335. we have recommended RECOHOME future sell on rise with target 276 to 250 and strong resistance level is 342 .


JUSTIFICATION

TATA ELXSI FUTURE made a bearish flag pattern at weekly chart and trading below weekly
support level; 1000 ,As per bearish flag pattern we have recommend sell on rise strategy

with target 940 to 896.45 level . and there is strong resistance level 1052.


JUSTIFICATION

BIOCON in this week given good upside rally this week it given close around 661 near to highest levels, buy on decline strategy don’t go for short sell use any decline for buying only, best buying levels around640-645 + keep stop loss of 624 below on close upside it will be test around 680-700+ levels watch out.


JUSTIFICATION


ADANIENT in weekly chart showing first signal for upside move, this week it taken good support
around weekly lower levels and given reversal and close around 200 DMA levels if it sustaining above this levels then upside good move possible here buy on decline around 160-161 keep small stop loss of 151 below on close upside it will be test around 185+ watch out.5+ 


watch out.

Saturday, 13 October 2018

Equity Weekly Report - 15 - 19 Oct 18 | Zoid Research

NIFTY (SPOT) @ 10472

Nifty this week given close around 10472 with green note, this week we saw high volatility
due to global market uncertainty and some good and bad news related to global market
condition, but finally end of this week it given close with green note and it has good support
around 10150-10200 on closing basis if it hold this levels then more upside move we will
see in upcoming sessions, upside it has first resistance around 10595 and second will be
10720 and weekly trend decider level is 10360-10370 on closing basis keep close watch on
these given levels.


BANK @ 25395 

Nifty Bank this week given close around 25395 with bullish note, this week we saw it
traded both side but end of this week given close around higher levels due to short covering
move, downside it has good support around 24500 on closing basis and upside it has first
resistance around 25830 and second will be 26250+ and weekly buying levels is 25380-
25400, work with strict stop loss and keep close watch on global market also.


JUSTIFICATION

TATA POWER had been framed a Bullish green big candle in weekly chart also share close above major resistance level 67.20 we have recommended TATA POWER future buy on dip with target 74 to 79 and strong support level is 65 .


JUSTIFICATION

MARUTI FUTURE trading above 7250 weekly multiple resistance level 7200, and made a bullish hammer candle we have recommend buy on dip strategy with target 7450 and 7750 level. And there is strong support level 6970.


JUSTIFICATION

ADANIPOWER in this week given good upside rally this week it given close around 32.55 near to highest levels, buy on decline strategy don’t go for short sell use any decline for buying only, best buying levels around 28.5-29 + keep stop loss of 25 below on close upside it will be test around 35- 38+ levels watch out.


JUSTIFICATION

ITC in weekly chart showing first signal for upside move, this week it taken good support around weekly lower levels and given reversal and close around 200 DMA levels if it sustaining above this levels then upside good move possible here buy on decline around 270-272 keep small stop loss of 265 below on close upside it will be test around 290+ watch out.


Saturday, 6 October 2018

Equity Weekly Report - 8 Oct to 12 Oct 18


NIFTY (SPOT) @ 10316


Nifty was closed below 10350 I,e @ 10316.45 in the closing of the week as followed by bearish trend. Nifty spot still trading below 50 MA in weekly chart and showing a almost black crows technical pattern. In the last five days of trading sessions somehow Nifty spot has been traded in a consolidation range b/w 11000-10500 with lots of zigzag and still closing below 10 EMA and 200 EMA in daily chart. Nifty spot has completed 50% on Fibonacci and may take a short support at 10300. If falling further then we can expect Nifty spot to be kissing the level of 10100-9800 in further expiry.


BANK @ 24443


Nifty Bank was closed with bearish spike candle and could not able to survive on positive note. Banking sector imposing heavy Supply and traded below 10 EMA and 200 EMA during the weekly trading session. In the last four trading session Bank nifty has performed very badly and continuous bearish trend was formed and finally closed below moving average of 50. If bank nifty still follows the same pattern and trend then free fall can be seen up to 23700-23000 in daily chart. Bank nifty has small support in the chart at 23500, if breakdown will seen then heavy fall was assumed.


CANDELSTICK CHART :- SBIN


JUSTIFICATION

SBIN had been framed a rally base drop pattern in weekly chart also share close below 100 days & 200 days moving average as per pattern and close below 200SMA we have recommended SBIN future sell on rise with target 250 to 235 and strong resistance level is 274


JUSTIFICATION

GAIL FUTURE trading below weekly multiple support level 360 , and made a bearish big red candle we have recommend sell on rise strategy with target 300 and 270 level . and there is strong resistance level 377.50


JUSTIFICATION

JINDALSTEEL&POWER in this week facing huge selling pressure, this week it given close around 175.9 near to weekly close, sell on rise strategy don’t hurry for buy, sell on rise for intraday basis, best selling levels around180-181 and according to weekly chart it has strong resistance around 192+ on closing basis when it close above these levels then some upside move possible, otherwise downside it will be go for 165-154 also watch out.


JUSTIFICATION ADANIPORT in weekly chart continue facing selling pressure, this week is given close around 301.8, sell on rise strategy don’t go for buy side this week it given close below 200 DMA levels so that major downfall we will see in upcoming sessions upside it has strong resistance around 325-327+, and best selling levels around 310-312 on weekly basis watch out and downside it will be test 290-275 levels also.